
Compound Interest Calculator 2026 – Investment Growth USA Tools
Building wealth here in the States often feels like an uphill battle if you are just leaving your savings sitting in a standard brick-and-mortar bank account earning next to nothing. Whether you are funding a Roth IRA, setting aside cash for a down payment, or trying to map out your long-term retirement timeline, letting your money compound over time is the ultimate cheat code. That is why plugging your numbers into a dependable compound interest calculator changes everything, showing you exactly how exponential growth can turn modest, regular contributions into a serious nest egg down the road.
The Cost of Waiting Too Long
Putting off your investments by even just a few years can rob you of massive compounding gains, forcing you to save double or triple the amount later in life just to reach the exact same financial finish line.
Your Wealth-Building Playbook
Take the guesswork out of your financial future. By using a trusted compound interest calculator consistently, you can test out different annual return rates, adjust your monthly contributions, and watch your portfolio trajectory scale up with total clarity.
Analyzing Your Wealth Accumulation Horizon
1. Core Inputs & Variables
- Principal Deposit: The initial lump-sum seed capital deployed into your brokerage, IRA, or high-yield savings account.
- Recurring Contributions: Scheduled monthly or annual dollar infusions that accelerate snowball asset momentum over time.
2. Compound Engine Metrics
- Compounding Frequency: How often generated returns cycle back into principal—ranging from daily yield reinvestment to standard annual calculations.
- Real Purchasing Power: Factoring baseline inflation benchmarks into projected gains to evaluate true long-term wealth growth in the US economy.
The Dynamic Compounding Analytics Engine
Compound interest turns time into your greatest financial ally. The underlying mathematical modeling processes initial balances, recurring inflows, and compound schedules using this multi-variable algorithm:
Step 1: Baseline Principal Growth Formula
Calculates exponential growth on your starting capital over specified time intervals:
Step 2: Total Future Portfolio Valuation with Series Deposits
Combines initial compounded principal with the future value of continuous automated monthly contributions:
Strategic Execution: Bridging the Optimization Deficit
If Your Wealth Velocity is On Target
If your portfolio projections match your long-term retirement goal, focus on asset location and tax efficiency. Maximize tax-advantaged buckets like Roth IRAs and 401(k) accounts first to shield compounding gains from annual capital gains taxes. Rebalance periodically to preserve capital while allowing dividend reinvestment plans (DRIP) to maintain steady asset accumulation.
If a Growth Gap is Detected
When projected wealth falls short of your financial target, model higher contribution tiers or extend your investment timeline. Leveraging our dynamic compound interest calculator reveals how small incremental increases in monthly savings can dramatically close performance gaps over a multi-year investment horizon.
Wealth & Investment Growth FAQs
How can an investment growth calculator help plan for long-term retirement?
By using a precise investment growth calculator, you can stress-test different return scenarios, inflation estimates, and contribution amounts. This clarity allows US investors to map out realistic multi-decade goals across 401(k) plans, IRAs, and taxable brokerage portfolios without relying on guesswork.
What average rate of return should I use for long-term US stock investments?
Historically, broad-market stock index funds like the S&P 500 have generated annualized nominal returns around 10% over decades. For realistic long-term planning, financial advisors often recommend using a conservative 6% to 8% inflation-adjusted rate of return.
How does compounding frequency impact my final portfolio value?
The more frequently interest compounds—whether daily, monthly, or annually—the faster your returns generate secondary earnings. While the mathematical difference between monthly and daily compounding is modest, both significantly outperform simple annual calculation schedules over time.
Why should I reinvest dividends in my compound growth strategy?
Reinvesting dividends automatically purchases additional shares of your assets. Over extended timeframes, dividend reinvestment plans (DRIP) act as an engine boost, accelerating total share accumulation and expanding your compounding base exponentially.
Arizona Paycheck Calculator 2026:
Calculate Your Net Pay After Taxes Accurately
Figuring out your take-home pay in Arizona shouldn’t feel like a guessing game. Whether you’re working in Phoenix, Tucson, or Scottsdale, this live calculator tracks federal income tax, FICA contributions, and Arizona’s state tax rate to reveal your true net earnings per pay period.
Continuous take-home pay modeling. Factoring Arizona Department of Revenue (ADOR) tax guidelines.
Arizona Paycheck Calculator:
Understand Your Net Pay and State Tax Deductions
Stop wondering how much money will actually land in your bank account every pay period when dealing with federal tax brackets, FICA withholdings, and Arizona’s state income tax system.
Introduction: Maximizing Wealth Accumulation via the Compound Interest Calculator
Building long-term wealth in New York or planning early retirement in California requires absolute mastery over your investment growth trajectory. Most American retail investors approach financial planning completely blind to how subtle contribution shifts and fluctuating annual yields aggressively impact their portfolio compounding power across active decades.
They track aggregate savings via surface-level banking apps, celebrating a minor monthly deposit increase while completely ignoring the underlying exponential math that drives sustainable retirement freedom. This reliance on fragmented financial tracking creates an unsustainable operational bottleneck: without leveraging a consistent Compound Interest Calculator, you commit to a rigid savings plan, only to discover your wealth accumulation falls short of inflation because your planning framework fails to project real-world market volatility and tax implications in real time.
Key Takeaway / Quick Summary
A reliable Compound Interest Calculator safeguards your financial future by continuously projecting portfolio growth across stocks, bonds, and high-yield savings accounts. By tracking contribution frequencies and interest rates early, US investors can systematically boost their long-term capital gains without guesswork.
To fully understand how exponential growth alters your financial landscape, consider these essential portfolio planning metrics utilized by top-tier US wealth managers:
- Initial Principal Impact: Your starting capital sets the foundational multiplier for future earnings.
- Contribution Frequency: Automating bi-weekly or monthly deposits accelerates the compounding effect significantly.
- Time Horizon Advantage: Starting your investments a decade earlier often doubles your final payout without adding extra cash out-of-pocket.
Real-World USA Example
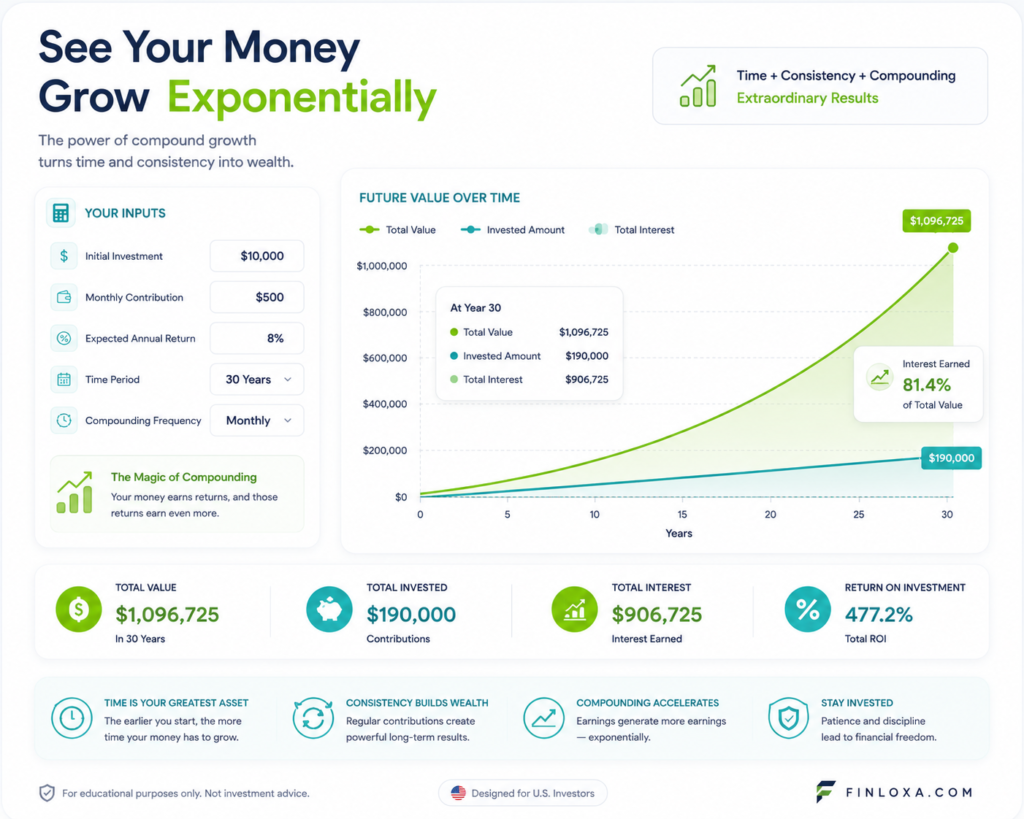
Consider an investor in Dallas contributing $500 monthly into an S&P 500 index fund averaging an 8% annual return over 30 years. Using a Compound Interest Calculator reveals a final portfolio value exceeding $745,000—demonstrating how consistent compounding transforms modest savings into serious generational wealth.
The definitive path to sustainable financial independence requires an immediate systems upgrade. By running your portfolio projections through an active calculation matrix governed by a robust Compound Interest Calculator, you secure the high-probability clarity needed to navigate complex investment vehicles and secure absolute command over your economic future.
Investment & Financial Disclaimer: The portfolio estimations, growth tracking frameworks, and calculation tools provided on Finloxa.com are intended strictly for educational, strategic planning, and informational purposes. They do not constitute formal financial counseling, certified investment advice, or guaranteed market returns. Individual portfolio values fluctuate based on market conditions, economic shifts, and asset allocation; always verify critical investment parameters directly with certified financial advisors or registered broker-dealers.


Compound Interest Calculator 2026 – Investment Growth USA
Step-by-Step Execution Guide
Building long-term wealth in the US market relies heavily on harnessing the snowball effect of compounding returns. Utilizing a high-precision Compound Interest Calculator enables you to map out future account balances, project reinvested earnings, and optimize recurring contributions across brokerage accounts, IRAs, or 401(k) plans.

Step 1: Preparation
Before running investment simulations, organize your starting capital and establish realistic baseline assumptions suited to current market conditions.
- Identify Initial Principal: Input your current lump-sum investment or starting account balance into the engine.
- Determine Contribution Schedule: Establish monthly or annual recurring deposits to measure how steady dollar-cost averaging accelerates yield.
- Analyze Target Return Rates: Selecting accurate annual return metrics inside an investment growth calculator helps ensure your baseline projections align with historical S&P 500 benchmarks.
Step 2: Implementation
Fine-tune compounding intervals and adjust timeline parameters within an online Compound Interest Calculator to observe long-term financial trajectories.
- Select Compounding Intervals: Choose between daily, monthly, or annual compounding options depending on dividend reinvestment plans (DRIP) or High-Yield Savings Account (HYSA) terms.
- Set Investment Timeline: Extend your time frame from 10 to 30 years to uncover how exponential interest curve shifts happen past decade two.
- Factor Inflation Adjustments: Apply an average 2.5% inflation rate to assess real purchasing power versus nominal dollar growth over time.
Step 3: Review and Finalize
Finalize your multi-year strategy by evaluating tax-advantaged account placement to keep more of your investment gains.
- Optimize Account Shells: Maximize tax-deferred growth using Traditional 401(k) accounts or tax-free growth through Roth IRAs to eliminate tax drag.
- Automate Ongoing Contributions: Schedule direct deposit allocations to your investment platforms to maintain consistent compounding momentum.
This investment planning guide adheres to financial education standards established by the U.S. Securities and Exchange Commission (SEC) and the Financial Industry Regulatory Authority (FINRA).
🛠️ Wealth Building Tip: Increasing your monthly investment by just 1% each year creates a compounding multiplier effect that can add tens of thousands of dollars to your overall portfolio over a 20-year horizon.